# How I track my token maxxing
Published: 2026-05-30
Tags: cli, claude-code, codex
---
Back in February 2026, I wrote two posts about how I am tracking [Codex CLI](/blog/codex-tokens-usage/) and [Claude Code](/blog/claude-code-tokens-usage/) token usage. During that time, I used both CLI agent tools for work and personal projects.
Both posts used a tool called `ccusage` and its variant (at that time), `@ccusage/codex`. [`ccusage` is created by `ryoppippi`](https://github.com/ryoppippi/ccusage) and is a popular command-line tool to analyze coding agent token usage and costs from local data that lives in your Claude or Codex sessions. It also support other [CLI agents](https://github.com/ryoppippi/ccusage#supported-sources) and its latest version provides daily, weekly, monthly, or session usage stats.
It's latest version also allows seeing the combined usage stats from Claude and Codex. All I need to do is run the following command:
```
bunx ccusage
```
And the output would be:
| Date | Agent | Models | Input | Output | Cache Create | Cache Read | Total Tokens | Cost (USD) |
| ---------- | ------ | -------- | -----: | -----: | -----------: | ---------: | -----------: | ---------: |
| 2026-05-30 | All | | 407.2K | 334.5K | 933.6K | 17.3M | 18.9M | $33.55 |
| | Claude | opus-4-8 | 71.5K | 305.4K | 933.6K | 11.0M | 12.3M | $19.32 |
| | Codex | gpt-5.5 | 335.7K | 29.1K | 0 | 6.3M | 6.6M | $14.23 |
Recently, I found about [`tokscale`, which is created by `junhoyeo`](https://github.com/junhoyeo/tokscale). It pulled me in from the first use because it provides more insights with a heatmap and daily session usage in a single dashboard and I don't have to remember different command-line options.
The default `bunx tokscale` opens an interactive TUI where you can navigate between Tokens per day/hour view, Models, Stats, and per agent.
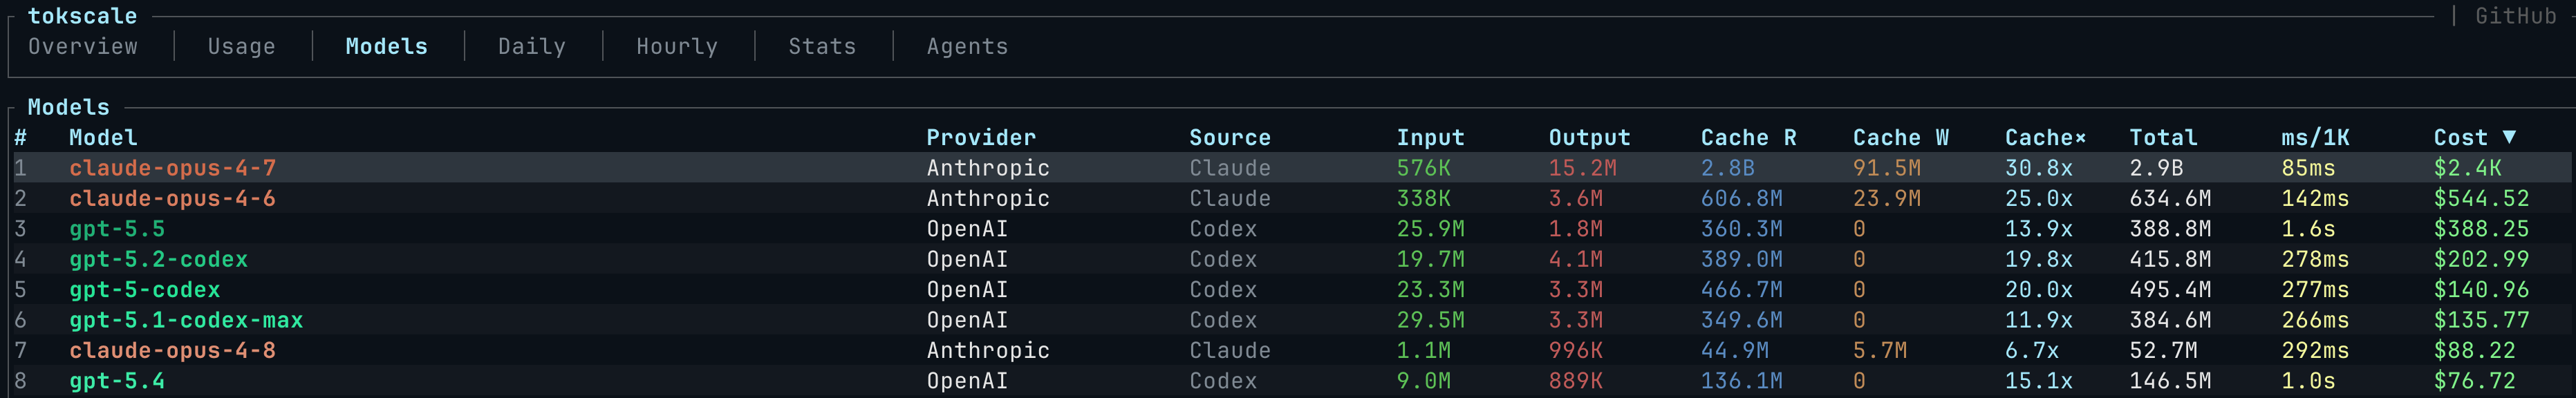 The above is my favorite screen from the TUI because it clearly allows me to see the total tokens and cost estimation summaries for each model I have used on my machine since December 2025.
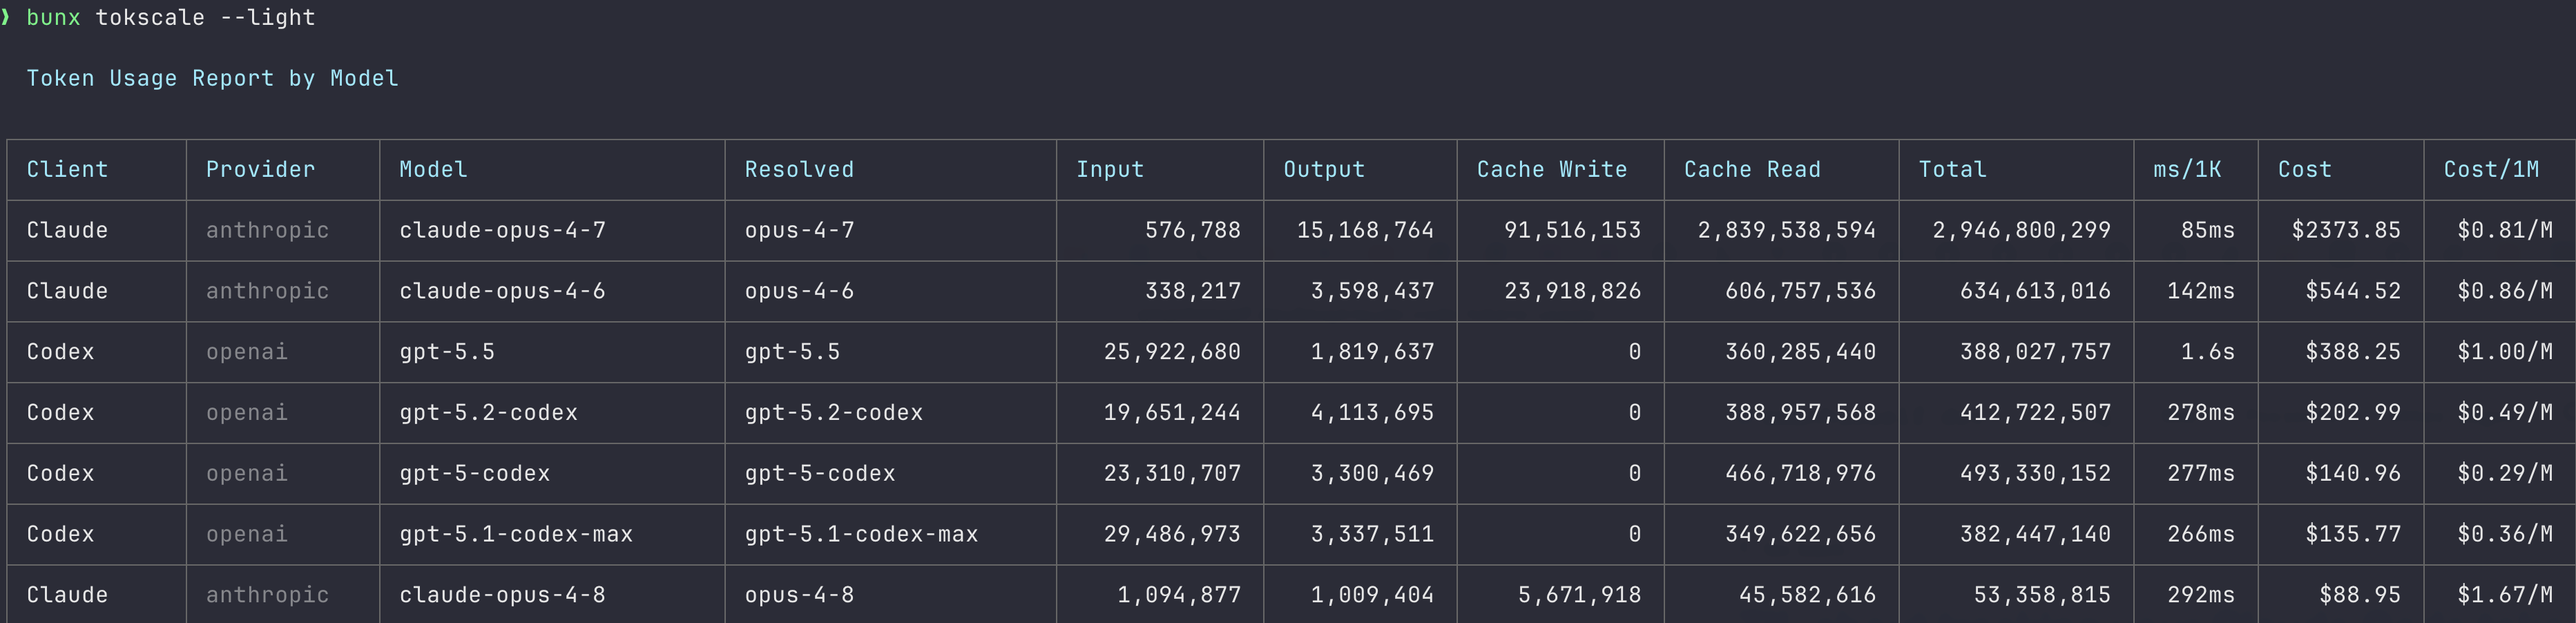
`tokscale` also comes with a `--light` version, which allows viewing the above information quickly.
The above is my favorite screen from the TUI because it clearly allows me to see the total tokens and cost estimation summaries for each model I have used on my machine since December 2025.
`tokscale` also comes with a `--light` version, which allows viewing the above information quickly.
 Since those two posts back in February, checking this has quietly become a habit. `ccusage` is still my quick check when I just want a number in the terminal, and `tokscale` is the one I open when I want to look around, mostly for that model summary screen and the heatmap.
I do feel like I am in early days of using these agent tools and there is no way I am bothered about the pricing and usage. I hardly ever hit my 5 hour session limit with my current subscriptions. Maybe I am not really _token maxxing_. However, I do like that both tools are useful tool in what they do and provide me an insight on how much tokens consumed for a given day or session. I am sure as I use these tools more, I will find more insights and patterns in my usage. If you are using these agent tools, I highly recommend checking out both `ccusage` and `tokscale` to get a better understanding of your token usage.
Since those two posts back in February, checking this has quietly become a habit. `ccusage` is still my quick check when I just want a number in the terminal, and `tokscale` is the one I open when I want to look around, mostly for that model summary screen and the heatmap.
I do feel like I am in early days of using these agent tools and there is no way I am bothered about the pricing and usage. I hardly ever hit my 5 hour session limit with my current subscriptions. Maybe I am not really _token maxxing_. However, I do like that both tools are useful tool in what they do and provide me an insight on how much tokens consumed for a given day or session. I am sure as I use these tools more, I will find more insights and patterns in my usage. If you are using these agent tools, I highly recommend checking out both `ccusage` and `tokscale` to get a better understanding of your token usage.